Reorgs Demystified: Insights From Monitoring With a Sensor Network

Polygon PoS is one of Ethereum’s largest scaling solutions, and with it comes an increased need for observability. More specifically, as Polygon Labs’ engineers, how do we answer questions such as: What makes a blockchain healthy? What metrics do we need to collect? In this blog post, we’ll deep dive into one component of network health: reorgs.
Most, if not all, chains encounter reorgs, yet they are still something of a mystery. Further research into the topic would greatly benefit the Web3 space as a whole. Let’s dive in.
So what exactly is a reorg? Reorgs occur when two parts of a network need to reintegrate with each other. In other words, two forks need to merge to produce one canonical chain.
These forks can be caused by serious protocol issues or minor issues like network latency and block propagation delays. Eventually, the blockchain will have to resolve which chain is the canonical chain through the fork choice rule, which causes a reorg.
Small (one block) reorgs regularly happen in PoS and are just side effects of a globally distributed system. However, reorgs that consist of a large number of blocks can be detrimental to network health. These deep reorgs can cause increased network delays, node costs, and can complicate dApp development.
Reorg Monitoring
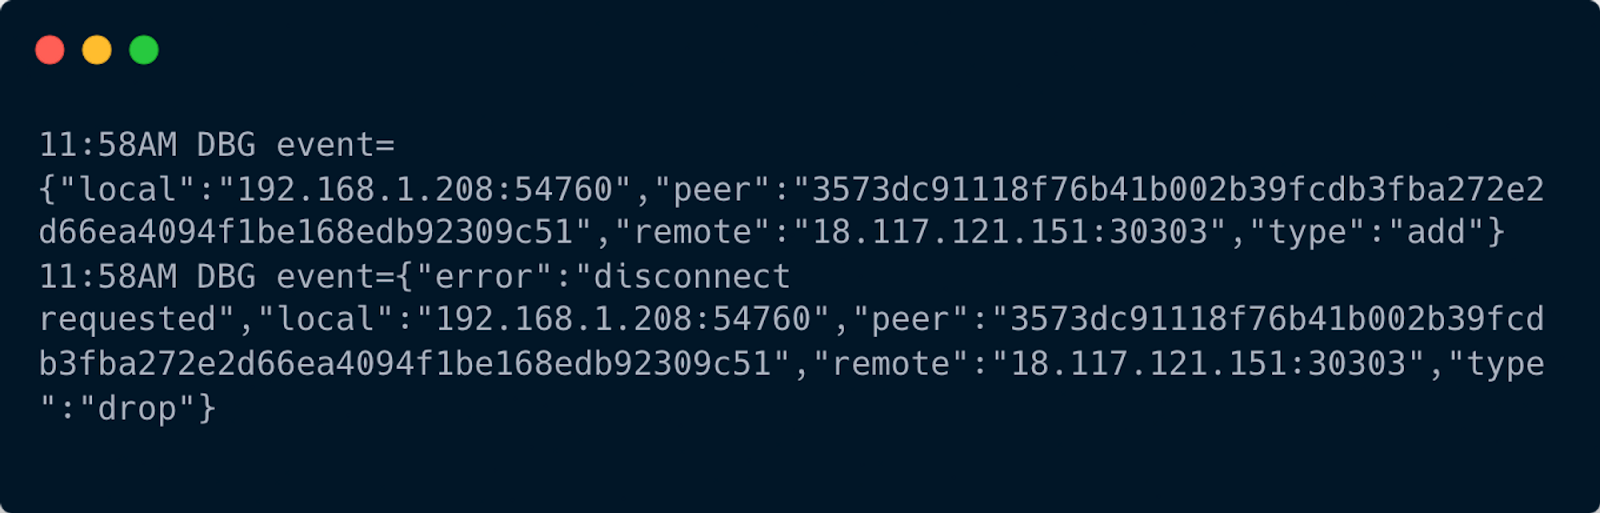
Historically, the Polygon PoS network’s reorg monitoring data came from two different places: ethstats-backend and bor logs. Some of the full nodes on Polygon PoS are set up to emit logs to Datalog. Here’s an example of the reorg log:

The important part of this log is the “drop” value. This indicates how many blocks were dropped in order for this reorg to occur, or more generally, the reorg depth. If monitoring systems detected a particularly deep reorg, then it would make sense to analyze the blocks that were produced in that reorg.
In tools like Polygon Scan, we can only see the blocks that are part of the canonical chain. If blocks were part of a reorg, then they wouldn’t be queryable. Polygon Scan also tracks some reorgs on their Forked Blocks page. The full nodes that power their blockchain explorer are likely only run in a few geographical regions. The problem occurs when forks happen outside of the regions they observe and get reorganized before ever reaching their full nodes. One solution could be to spin up more full nodes in different regions around the world, but this is a costly endeavor. The sensor network, a globally distributed reorg monitoring tool discussed later, addresses this problem.
The original solution we came up with was to leverage the data coming out of ethstats. https://github.com/maticnetwork/ethstats-backend was developed to be used as a proxy for https://github.com/goerli/ethstats-server and would archive the blocks that were emitted by the nodes connected to ethstats. You can view ethstats-server in action here.

The biggest limitation of this system was that our view of the network was limited to our own infrastructure. If there was a rogue node causing issues or forking blocks, we would have no visibility. To address these issues, we developed the sensor network to observe block propagation directly on “devp2p”, a set of peer-to-peer networking protocols used by Ethereum.
Sensor Network
You can think of a sensor as a stripped-down Ethereum client that only does node discovery, communicates over the Ethereum Wire Protocol, and writes blocks and transactions to a centralized database. Everything else regarding block production, processing, or propagation has been omitted. This section covers some of the underlying concepts that make this “blockchain scraper” possible so you can learn how to create your own!
DevP2P
Anyone can build a sensor network that would benefit the whole Polygon ecosystem. Before you get started, let’s cover one essential concept to understand how exactly nodes communicate with one another. If you’ve ever started your own Geth or Bor node you’ll notice something like this:

This is the discovery version 4 (discv4) URL of one of the PoS Mainnet Bor bootnodes. You’ll notice that it generally takes the format “enode://ID@IP:PORT” but can also be seen in the format “enode://ID@IP:PORT?discport=PORT”. Nodes communicate over both TCP and UDP. The TCP port is the former port in the URL and the UDP port is the one after the “discport=”. If the “discport” is omitted, it means that both TCP and UDP are listening on the same port.
You can think of this as similar to the URL to a website, but rather than pointing to some HTML, it points to an Ethereum node. For the address above, it means that there is a server running on TCP port 30303, and if you wanted to peer with this node, that would be the port you dial. Similarly, the node is also listening to Node Discovery Protocol messages on UDP port 30303 which is how new nodes in the network can start building their peer list.
Let's now look at some of the messages that are being exchanged over the network.

If communicating at the RLPx Transport Protocol layer, then we would send a “Hello” message. This contains some useful information about the node such as the protocols, ID, and client the node is running. This is useful when determining what clients make up what percentages of the network. Additionally, if a couple of nodes are misbehaving, then seeing commonalities in the client version can be insightful. Here’s what the data of the “Hello” message would look like:

Our sensors actually leave the “Hello” message exchange to be managed by the https://github.com/ethereum/go-ethereum library, but it’s an important part of the peering process. Next is the “Status” message exchange.

The “Status” message contains more information about the state of the chain and this is where a lot of the node filtering comes into play. Sensors will disconnect with nodes that have a mismatching “NetworkID”. The sensor has to send a “Status” message to the peer, but some of these fields can’t easily be set since the sensor doesn’t store chain data like a typical Bor node. For example, if starting the node for the first time, it would have no idea what the head or total difficulty is. One way to overcome this is to just send back the same “Status” message that the peer sent. This works pretty well and prevents the peer from disconnecting from the sensor. However, this solution only works if the peer sends us their “Status” message first. Another solution would be to query the latest block from an RPC provider such as https://polygon-rpc.com/. Overall, sending the “Status” message first works much more often and is more reliable in the long run.
Now that the sensor and node have successfully peered, the sensor starts receiving blocks and transactions from the node. The sensor will receive more “NewBlockHashes” messages than “NewBlock” messages, so the sensor will have to send “GetBlockHeaders” requests to the peer to get the full block header. The same concepts also apply to transactions. Once the sensor receives the block and transaction data, it will write it to a database for later processing. This flow is how the sensor network gathers all of its data.
Architecture

Here’s the architecture for the sensor network. We run an array of sensors that connect over devp2p in a many-to-many relationship to nodes in the network. Although it says full nodes, it can realistically be any node that runs devp2p such as sentry nodes, Bor nodes, Erigon nodes, Geth nodes, etc. All of these sensors will write their chain data to a database.
Database
For our use cases, we chose to use GCP Datastore as the database solution for the sensor network because of its low latency, scalability, and flexible storage. If you’re curious about the entities being written to Datastore, you can view them here.
Creating Your Own Sensor
Now that you’ve learned about the sensor network and how it operates, let’s try building a stripped-down version together! The full source code of this demo can be found here, and if you’d rather check out the source for the production sensors we’re running, you can do so here.

Here we use https://github.com/ethereum/go-ethereum’s “p2p.Server” to start our devp2p server. This will handle listening on the TCP and UDP ports, the discovery process, and peering. Because “server.Start()” actually runs its own goroutine, we have the program wait for a “^C” to exit.
If you run this you’ll notice these logs:
So what the server is doing is adding and then immediately dropping a node. This is because we haven’t fully implemented the protocol section, so let’s do that now. We’re choosing to implement “eth/66” because it’s a common protocol found among PoS Mainnet nodes.

With this addition, you can start to see status messages from PoS Mainnet nodes being logged.

These nodes are still dropping us immediately because some of the fields in our status message are not completely set. Let’s set those parts now.
The barebones server doesn’t store any chain data, head block, or genesis, so there are a couple of tricks we have to do to get them peering. The simplest solution is to just copy the field of the status message above into the one that the server sends. The head may be a little behind, but it should be fine for demo purposes. Another solution could be to just query the latest block from https://polygon-rpc.com/. Let’s do the first solution.

It may take a while, but eventually, you should start receiving messages with different codes. These codes correspond to the messages here.

Congrats! You have successfully set up your own devp2p server. You can take this a couple of steps further by handling different message types.
Reorg Alerts
Now that we’ve developed and implemented the infrastructure necessary for the collection of reorganized blocks, we can finally start making observations from the data. The addition of the sensor network greatly improves reorg monitoring because we have significantly more network coverage which, in turn, means we have more data to analyze.
One of the tools that have developed out of the sensor network data is our reorg alerting system. We wanted a system to better visualize the reorgs that were observed in the network. Here’s one of the ten block reorgs we observed:
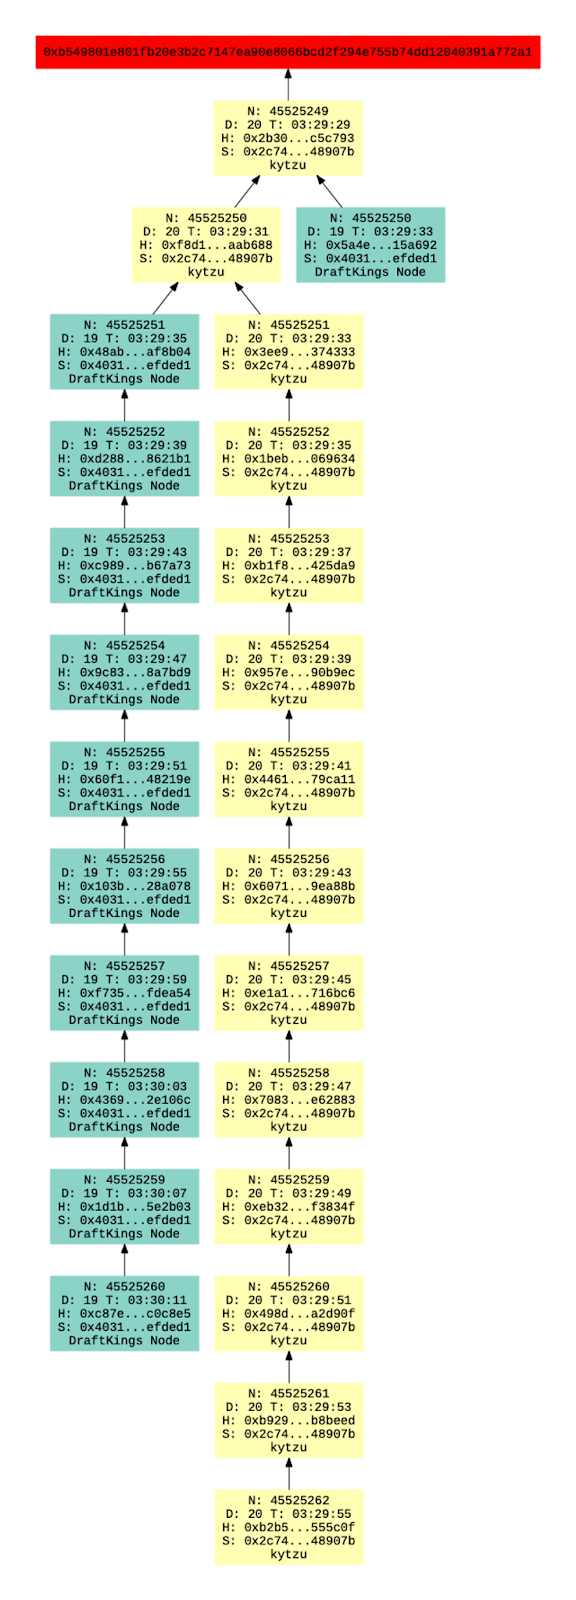
It may not be completely clear what each part of this graph means so let’s dissect it.
- The red rectangle with the hash is the root block. It just serves as the starting point for the graph, there’s no other significance.
- The arrows represent a child-parent relationship. It represents the path the block parent hash follows which may be a little counterintuitive if you’re thinking about it chronologically.
- “N” is the block number.
- “D” is the block difficulty.
- “T” is the timestamp.
- “H” is the abbreviated hash.
- “S” is the abbreviated block signer address.
- The last line of the block is the validator name, which is queried from the Staking API.
- The colors are used to differentiate which blocks come from which validator.
- The canonical chain is the one that is longer.
Architecture

Reorgs Alerts is a cron job that fetches the latest blocks from Datastore and determines whether to send an alert for a reorg or not. All of the observed reorgs are also stored in Datastore so no state is stored on the cron job itself. When constructing the graph, we use the Staking API to map the signer address to the validator name.
Reorg Depth Over Time

Because all the reorgs are written to Datastore, we have the ability to create accurate visualizations of the reorgs in the network. As of writing this, this is the most accurate visual for reorg depth over time in PoS.
Reorg Algorithm
So we have the data necessary to construct a visual, but how do we actually detect if there is a reorg? Previously we used Bor logs to determine if a reorg had occurred, but because devp2p doesn’t transmit logs, this solution can’t be reused. To solve this, a reorg detection algorithm was developed.
You can think of the data structure that the reorg graph represents as a directed acyclic graph (DAG). Due to the nature of the distributed network, there is a rare chance of a block being propagated that will never reach any of our sensors. A missing block would cause two parts of the graph to be completely disconnected, so the algorithm had to account for this. To counteract this, we separate the graphs into weakly connected components where in each subgraph, all vertices are connected to each other by some undirected path.

The first step would be to find the longest path or the canonical chain. In the reorg graph above the longest chain would be the chain of yellow blocks signed by “kytzu”. Next, find the leaf nodes and iterate through them. Let’s do one example starting with the “DraftKings Node” block number “45525260”.
Because this block isn’t in the longest path, we add it to the fork path and we move the block pointer to the parent. We keep checking the parent block and traversing following the path of the arrows until we reach a block that is part of the longest chain. Once we do, we now have a fork path with a length of ten. At this point, we can choose to send an alert depending on the size and the age of the reorg.
For our current alerting setup, we only alert of a reorg with depth greater than or equal to the sprint length. In PoS, a validator will be chosen to produce blocks for a sprint, so if there is a reorg that is deeper than a sprint, it means that it involves multiple validators. Other shorter reorgs can usually be ignored, as they are just side effects of latency in a peer to peer network.
Additional Insights

For the next two sections, we’ll be using this reorg graph to point out some additional insights.
Bogon Blocks
In the graph, at block heights “46415319” and “46415311” we see that there are blocks with an “?Unknown?” validator. We’re currently calling these bogon blocks. If we run a “diff” of the bogon block against the canonical block, then we can see that only a couple of the header fields change. Here the red represents the canonical chain.

This is enough, however, to change the hash and cause the validator to be “?Unknown?”, even though a majority of the header fields are the same.
The sensor network writes block events that capture which block was propagated by which node. Upon querying all the nodes that sent this block, we found that they were being propagated by Erigon nodes. The next question we answered was whether the current Erigon implementation was only propagating these corrupted blocks. Our analysis found that 97% of the blocks propagated by Erigon had a similar unknown signer issue and that 20% of the blocks our sensor archived were bogon blocks.
Double Signers
In the graph, we can see that Anonymous 93 signed two blocks at height “46415316”. Typically, a validator should only sign one block at a given height. Our analysis found that double-signing is pretty rare, with double-signed blocks making up about 0.23% of all blocks collected by the sensor network. We’re still investigating the root cause of this, but having a reorg graph generated significantly increased visibility into this problem.
Sealing Out of Turn
Blocks that are sealed out of turn are validators that are proposing blocks when it’s not their turn to propose. All the blocks proposed by Anonymous 93 would be considered blocks sealed out of turn because it would be Figment’s turn to propose. You can identify which validator is the primary proposer and the backup proposer by the difficulty—the highest difficulty is considered the primary proposer. Our analysis found that 19% of blocks collected by the sensor network were blocks that were sealed out of turn.
Stolen Blocks
Occasionally, if a non-primary validator proposes a block, there is a chance that it makes it into the canonical chain instead of the primary validator’s block. In this instance, we would call these stolen blocks. This is negatively impactful to the network because it can lead to reorgs and the primary proposer misses out on block rewards.

In the reorg graph above, the section outlined in red displays some stolen blocks. Here Luganodes stole four blocks from Worldpay from FIS. This can be identified because the Luganodes blocks have a lower difficulty but they are a part of the canonical chain. Our analysis found that 0.41% of blocks observed by the sensor network are stolen blocks.
Conclusion
The sensor network is a powerful tool, and we’ve only really scratched the surface of its possibilities. Here are some tools we plan on working on in the future that leverage the sensor network and the data it produces:
- Deploying a Mumbai sensor network.
- A live block visualization where you can see new blocks being added to the chain (including reorganized blocks).
- A block propagation visual where IPs are geolocated and blocks’ transmission paths can be seen.
We explored the intricacies of reorg monitoring and altering, the sensor network architecture, building your own sensor, and key insights that came from sensor data. The field of blockchain observability is still relatively new, so we hope this article provides an in-depth look at how Polygon Labs is contributing to on-chain monitoring.
Check out the technical blog for more in-depth content on the workings of Polygon protocols. Tune into the blog and our social channels to keep up with all of the updates about the Polygon ecosystem.
Together, we can build an equitable future for all through the mass adoption of Web3!
Website | Twitter | Developer Twitter | Forum | Telegram | Reddit | Discord | Instagram | Facebook | LinkedIn
More from blogs
.png)
Polygon DeFi 101: What Are Smart Contracts and How Will They Work in an Aggregated Network?
OKX Launches X Layer, Built with Polygon CDK, Enabling 50M+ Users to Tap Unified Liquidity of the AggLayer

Polygon Labs Awarded ISO 27001 Certification, the Gold Standard of Compliance for Information Security Management Systems
.png)
Moonveil Building Dedicated Chain with Polygon CDK to Level Up Web3 Gaming, with Focus on an Aggregated Ecosystem